One of the big challenges with managing Pierce’s disease in California vineyards is there can be tremendous variability in vector activity and Xylella fastidiosa spread among locations and over time. They’re moving targets. This is particularly true for the glassy-winged sharpshooter, which has strong seasonal patterns of activity and substantial year-to-year variability in activity.
Seasonal patterns of GWSS captures in Temecula Valley, with different colored lines denoting individual yearly patterns between 2005 and 2021 (so far)
GWSS captures tend to peak in early to mid-Summer, with smaller peaks in early Fall in some years, and occasional modest peaks in the Winter of some years.
Year-to-year variation in GWSS captures in Temecula Valley over the preceding 15+ years.
In the Temecula area, following initial outbreaks in the late 1990s through the early 2000s, GWSS captures were modest for several years. The exceptions were 2008 and approximately 2016 through 2020 (especially 2017!), which showed higher GWSS activity.
There are a variety of reasons why the time of year sharpshooters are most active matters when it comes to PD. There are also multiple reasons why some years are more/less favorable for GWSS (e.g., weather that year, coordination of management programs, etc.). Understanding what contributes to patterns of GWSS activity would be helpful for guiding the timing of when treatments should occur or how urgent the need is for GWSS management. Here, I’ll focus on the later, specifically on whether we can predict what’s going to be a bad year for GWSS versus years with more modest levels of GWSS activity. So far, 2021 is looking like a pretty intermediate year, but how confident should we be about that?
Areawide monitoring for GWSS in the Temecula dates back more than 20 years, with regular deployment/collection of hundreds of individual traps and reporting of counts throughout the main grape-growing portion of the area over the year. These counts are useful for addressing how predictable GWSS captures are in a given year.
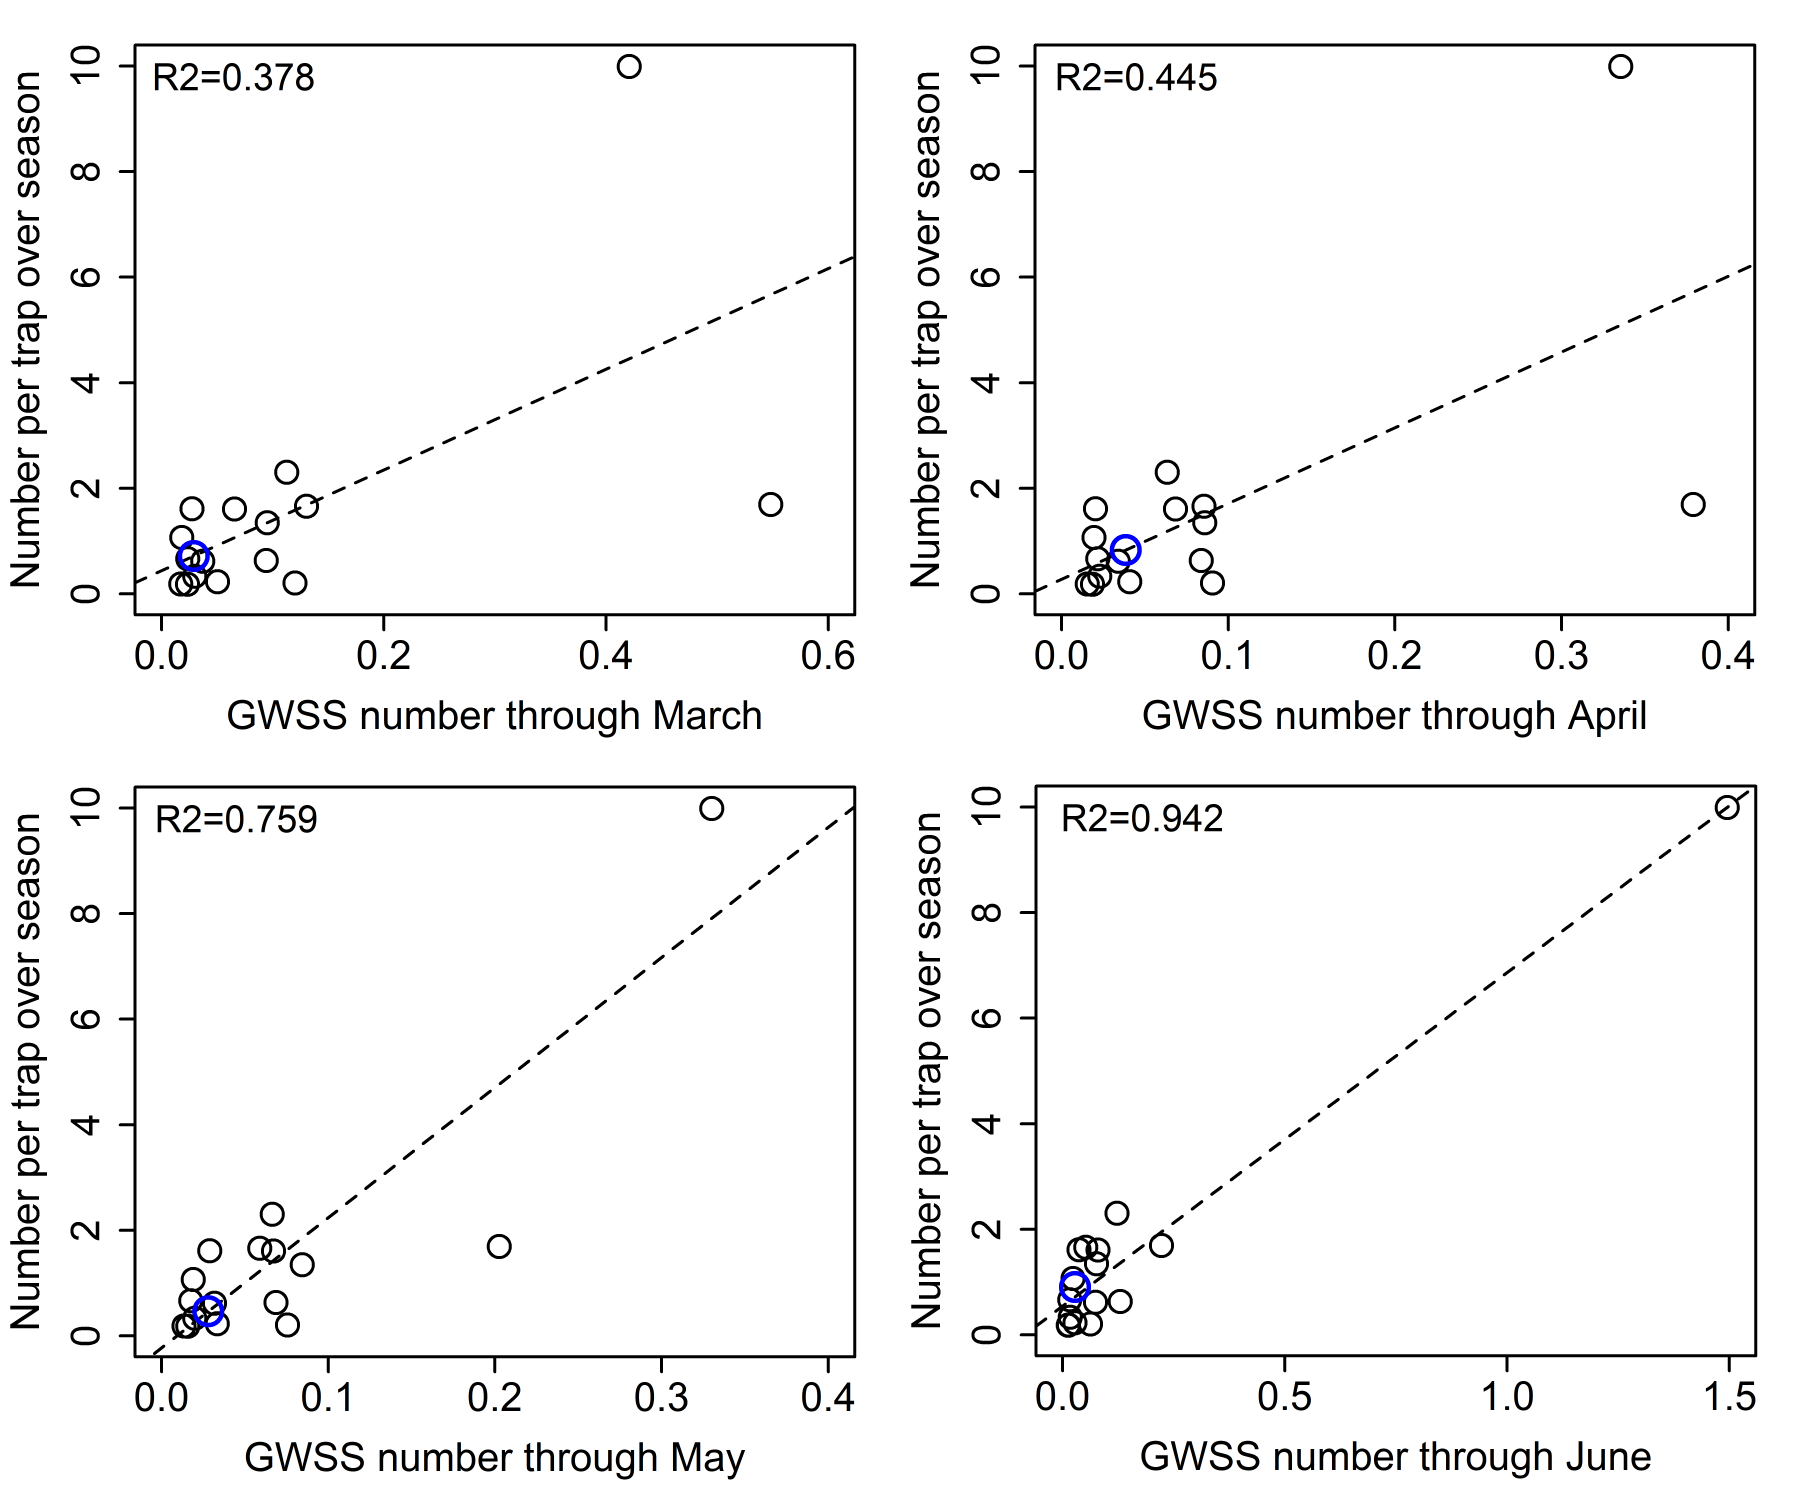
Using areawide GWSS trap catch between 2005 and 2020, I used a set of regressions to relate the total number of GWSS per trap from the beginning of the year up to one of 4 time points (March, April, May, or June) to the total number of GWSS caught on each trap over the entire year. In other words, how predictive are GWSS counts in Mar, Apr, May or Jun of how bad it will be over the year? In the panels below, broken down by month, the “R2” value in the upper left corner reflects how much variation the regression captures; a value near 1 means it does a great job, closer to 0 means it’s useless.
Regressions of number of GWSS up through a) March, b) April, c) May, or d) June on the cumulative number of GWSS per trap over the entire year. Blue points denote where things stand as of that month in 2021.
You’ll notice that even up through March, there’s decent “explanatory power”. An R2 of near 0.4 isn’t bad. However, it’s clear that counts going later into the season do an even better job. Counts through May, or especially June, provide a great picture for how extensive that summer peak of GWSS activity will be. But, how might this information be useful?
A common element of GWSS control in conventionally managed vineyards in Southern California is the application of systemic neonicotinoids, such as imidacloprid. Studies indicate that these insecticides, if applied at appropriate locations (i.e. certain soils) and times, can help to suppress GWSS, reduce their feeding, and limit pathogen transmission for extended periods of time. Yet, the timing of their application is important. Typically, it is recommended to apply them sometime in the Spring – after things start warming up enough for root growth and efficient uptake, but not so late that there is not sufficient time for adequate uptake before GWSS start to become active in vineyards.
Given the potential for huge interannual variability in GWSS abundance, imidacloprid applications in vineyards are likely to be more important in some years than others. Indeed, surveys during low periods of 2010 and 2011 indicated that they may not be warranted. The Temecula areawide monitoring data indicate that it’s possible to strategically gauge risk in a given year. Admittedly, the confidence that waiting till June would provide might be offset by the application occurring too late. But even May or April GWSS counts may afford enough confidence, especially based on what happened in the preceding season with respect to GWSS and PD, to make an informed decision.
All the more reason to pay attention to the results of GWSS areawide monitoring reported here for Temecula and for other areas of California by the CDFA.
